PhillyStat360: Vacancy Property Indicator

project overview
Which properties should the city inspect first? PhillyStat360 is a spatial machine learning system that turns fragmented administrative records into explainable vacancy-risk signals for 436,297 residential parcels across Philadelphia. Developed as a MUSA Smart Cities Practicum team project, my contribution focused on feature engineering, model development, and dashboard design.
client
City of Philadelphia OIT
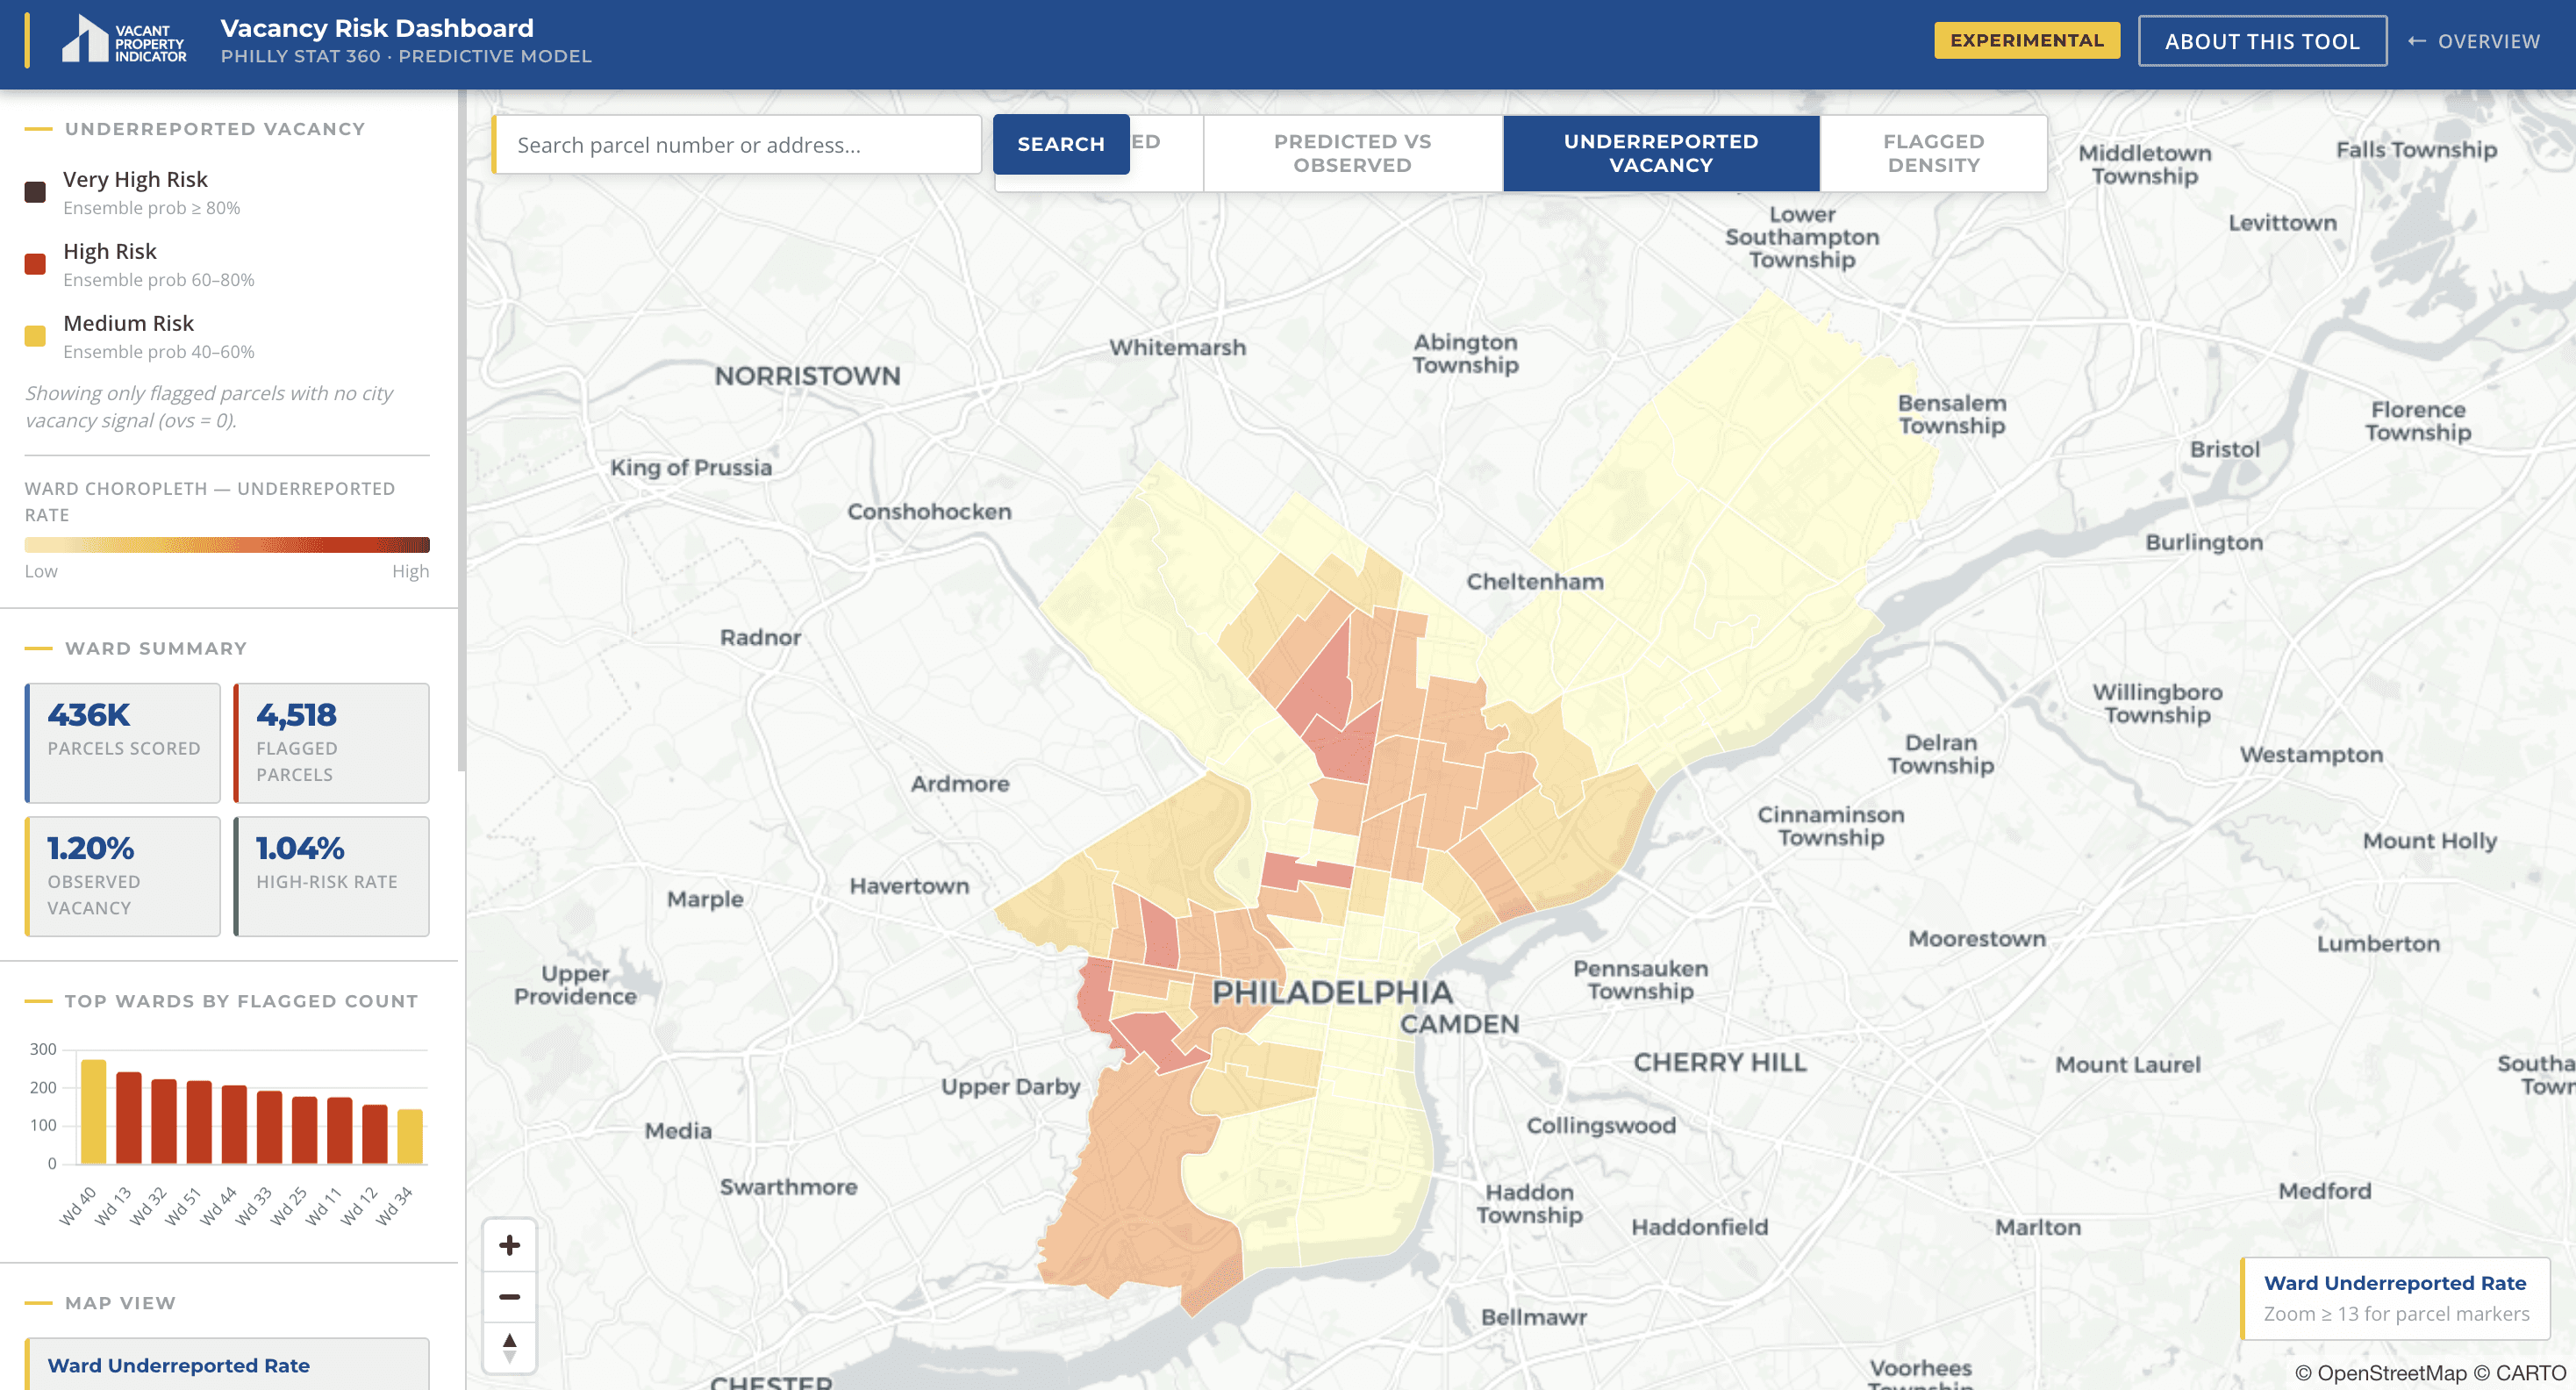
A citywide decision-support tool for exploring predicted vacancy risk and properties that may be missing from existing city records.
Vacancy Leaves a Trail
The useful signal was not a checkbox, but a sequence of events
Philadelphia’s existing Vacant Property Indicator combines five binary administrative signals using manually assigned weights. It provides a useful starting point, but properties rarely become vacant through one isolated event.
Deterioration accumulates. Violations become more frequent. Ownership changes. Licenses lapse. City interventions begin to appear.
The project reframed vacancy as a trajectory that can be observed across a property’s administrative history—not simply a yes-or-no field in a database.
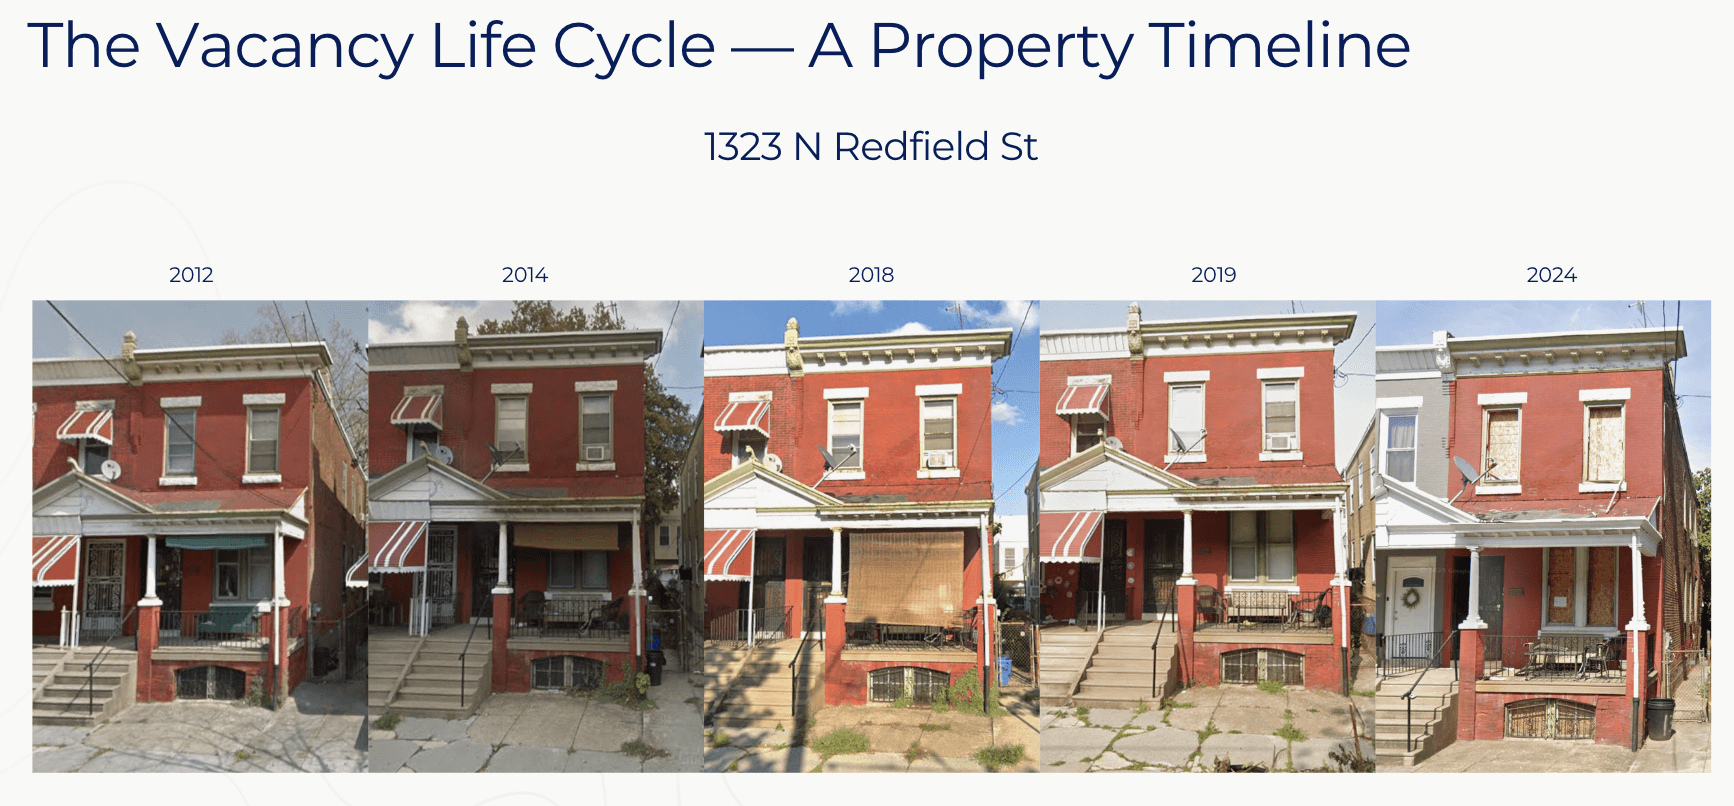
Vacancy develops gradually. A property’s physical condition can change over years before it becomes visible through a single administrative flag.
Turning History into Features
We designed the model to distinguish recent decline from long-term history
I led the feature-engineering process, transforming seven administrative datasets from three city agencies into 34 parcel-level predictors.
Instead of relying on lifetime totals, I created features across four time windows:
The last six months for current activity
The last two years for recent trends
The last three years for mid-term history
The last five years for long-term trajectory
The resulting features captured violation frequency and acceleration, Clean & Seal history, ownership transfers, license activity, building condition, and nearby vacancy patterns.
Every feature was constructed using records before a fixed training cutoff. Vacancy-defining codes were excluded from the predictors so the model could not simply reproduce its label.
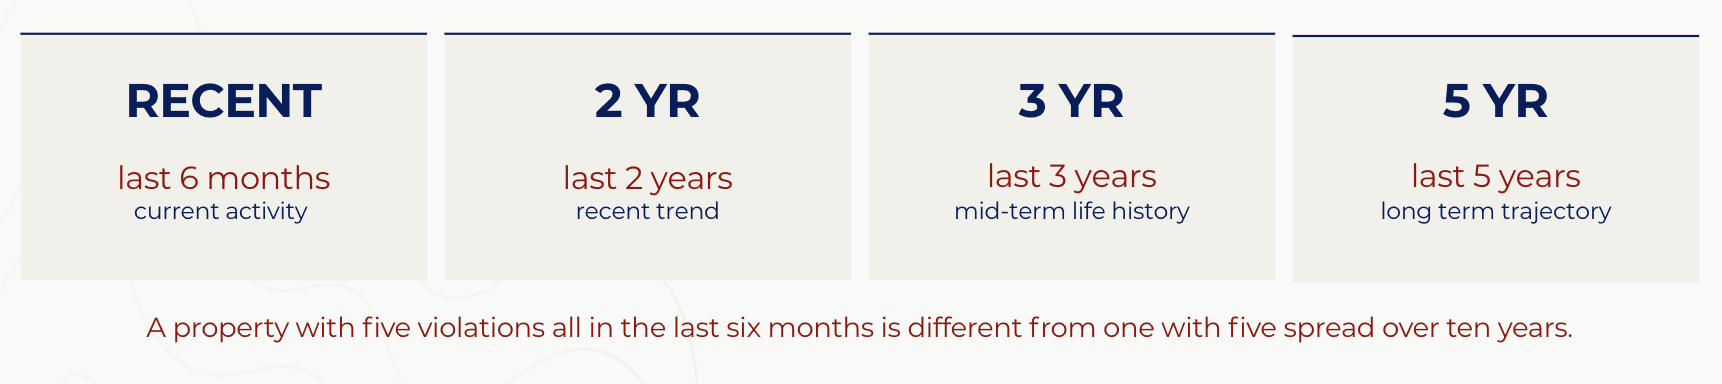
Five violations in six months describe a different risk pattern from five violations spread across a decade.
The Best Model Wasn’t the Most Complex
Model selection followed the evidence
We compared logistic regression, random forest, XGBoost, and LightGBM using the same feature set and validation framework.
Once leakage-prone features were removed, logistic regression and random forest outperformed both boosting models. The final production score became a calibrated 50/50 ensemble of the two strongest models.
The ensemble achieved:
0.940 ROC-AUC
0.546 PR-AUC
0.0068 Brier score
Because vacancy represented only about 1.1% of residential parcels, PR-AUC and calibration mattered more than accuracy alone. The model needed to rank rare cases effectively while producing probabilities that users could interpret responsibly.
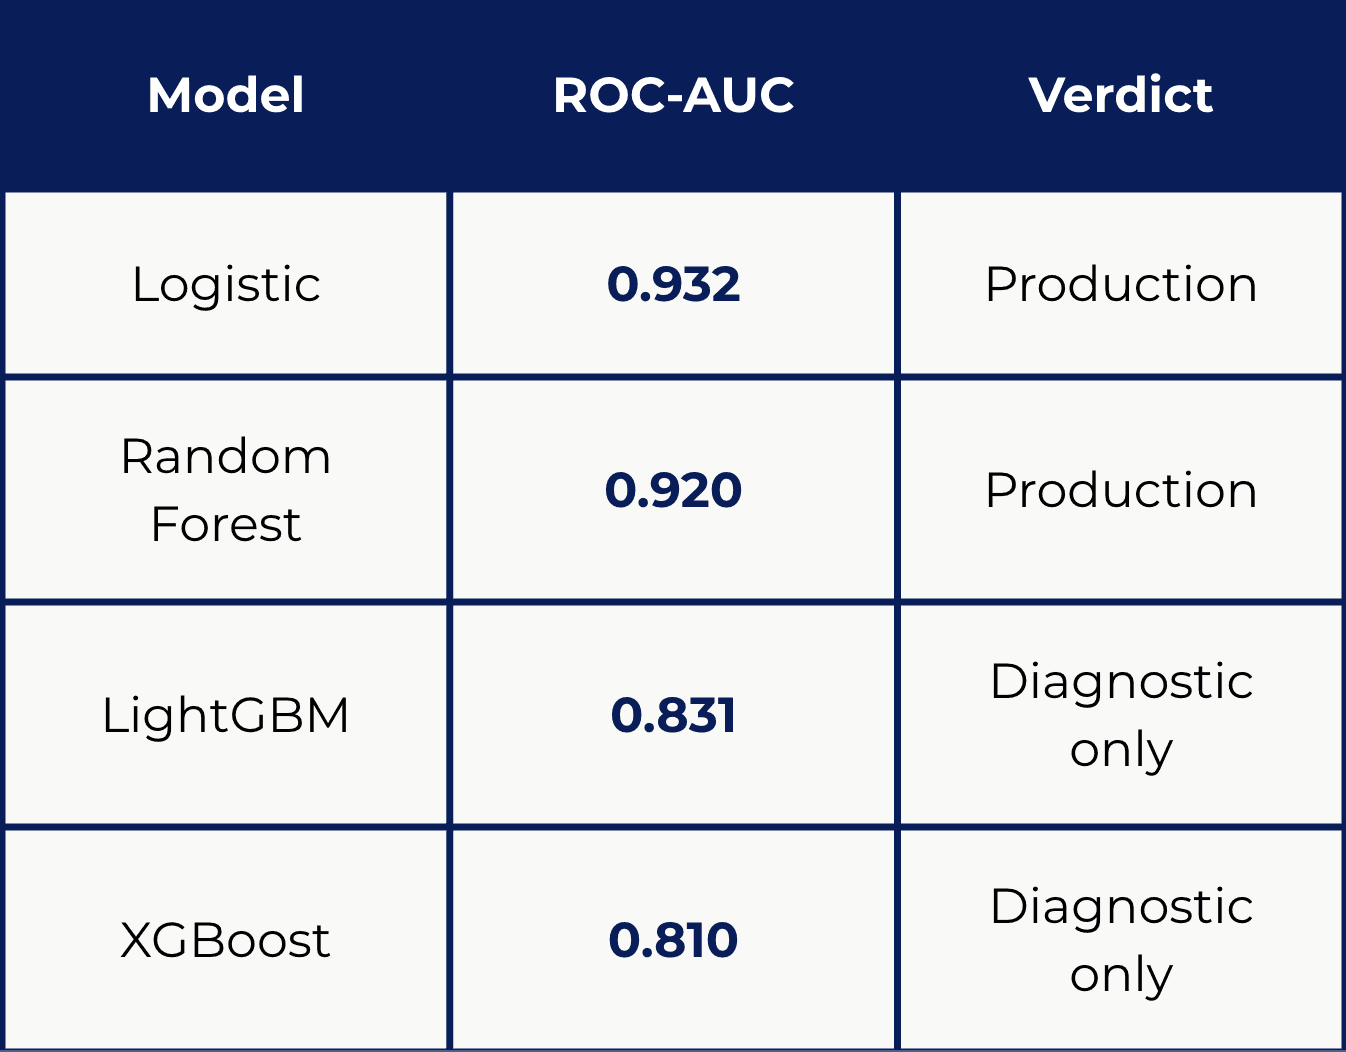
Complexity did not guarantee better performance. Logistic regression and random forest captured the available signal more reliably than the boosting models.
Testing What the Model Had Really Learned
Geography could not be allowed to inflate performance
Vacancy is spatially clustered. If neighboring parcels appear in both training and test data, a conventional random split can make a model appear stronger than it really is.
I therefore evaluated performance under multiple geographic validation strategies that kept entire ZIP-code groups or census tracts outside the training sample.
The model maintained:
0.940 AUC on the random test split
0.888 mean AUC under ZIP-grouped validation
0.968 mean AUC under census-tract block validation
The question was no longer just whether the model could recognize familiar neighborhoods, but whether it could generalize beyond them.
Same Workload. More Confirmed Vacancies.
The model only mattered if it improved prioritization
To compare PhillyStat360 with the City’s existing indicator, both systems were evaluated at a similar review volume of approximately 6,400 residential properties.
At that matched capacity:
City VPI achieved 53.3% precision and 57.6% recall
PhillyStat360 achieved 54.7% precision and 78.3% recall
The model improved recall by 20.7 percentage points while slightly increasing precision.
The value was not simply a better model metric. It was finding more relevant properties within approximately the same inspection workload.

At approximately the same review volume, PhillyStat360 identified substantially more confirmed vacancy cases
From a Risk Score to an Address
The dashboard turns model output into something people can inspect
I designed the dashboard around the questions a user would naturally ask:
Where is vacancy risk concentrated?
Which parcels have been flagged?
Where does the model disagree with existing city signals?
What changes when the analysis moves from citywide patterns to one property?
The interface supports citywide risk exploration, ward and tract filtering, address search, risk tiers, and parcel-level review. Dedicated views compare predicted and observed vacancy and surface model-flagged parcels with no current city vacancy signal.
MapLibre and PMTiles allow more than 400,000 parcel predictions to be explored through a lightweight static web application.
TreeSHAP analysis was also produced for the top 200 flagged parcels to identify the features most strongly associated with high-risk predictions.
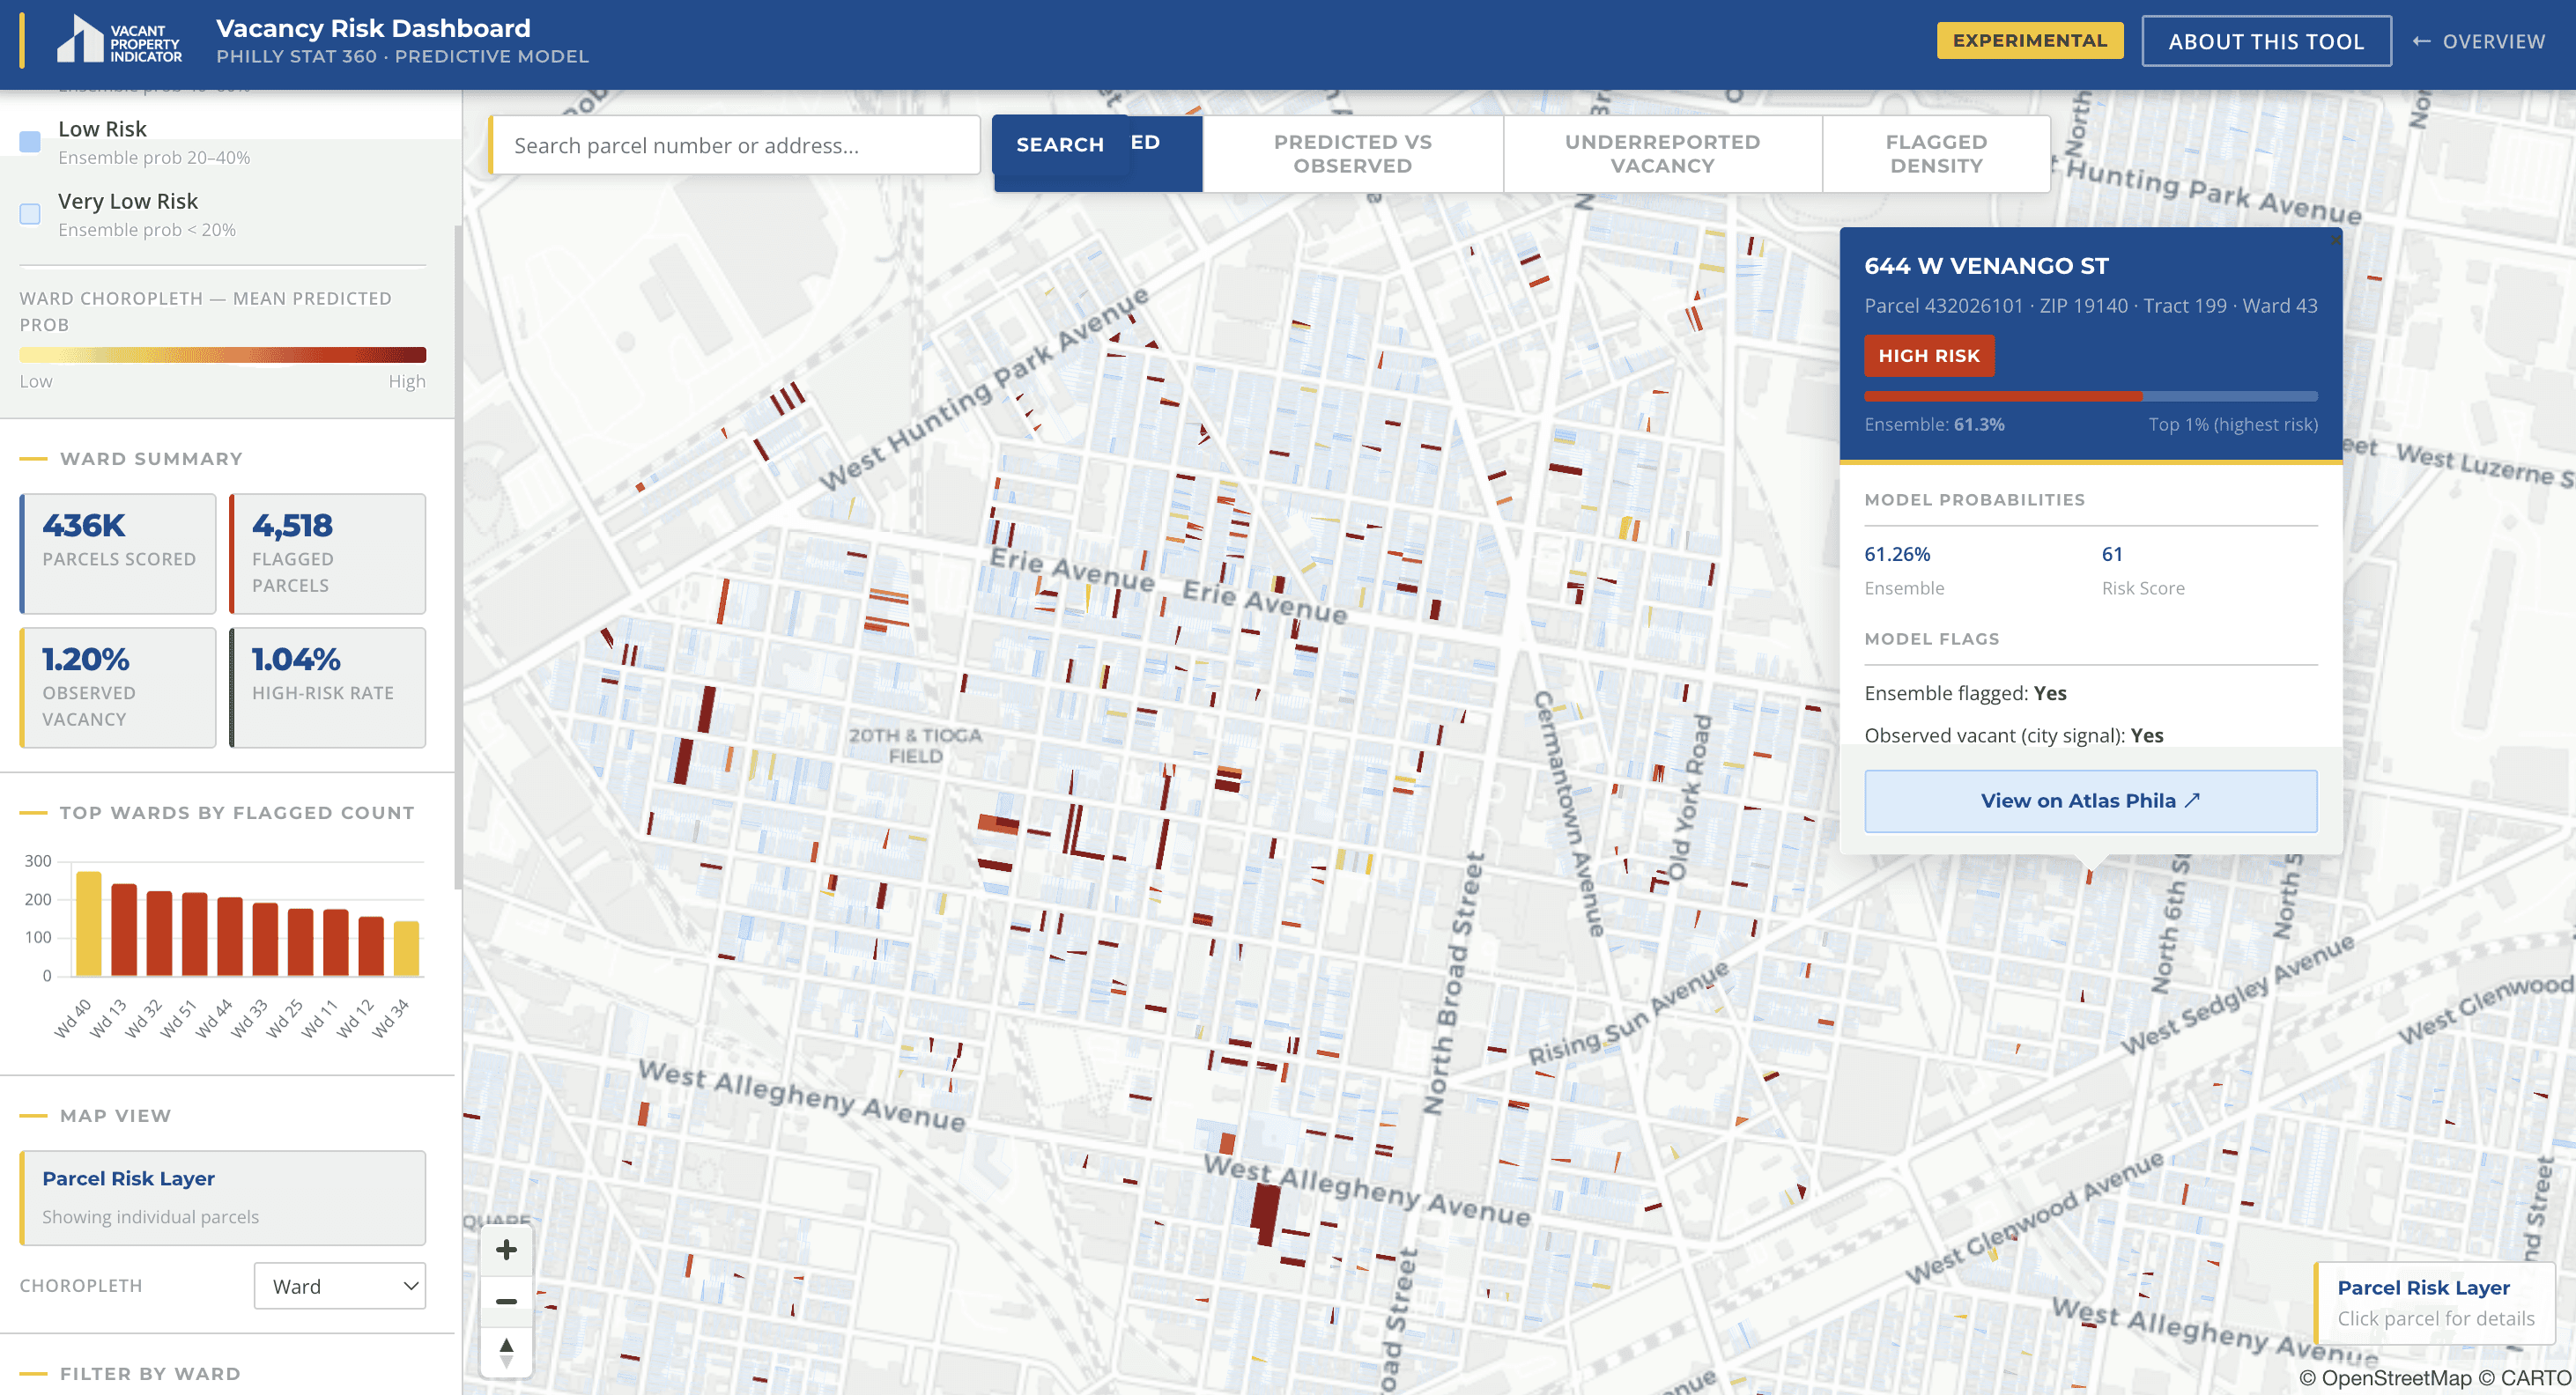
Users can move from a citywide risk pattern to a specific parcel and compare the model prediction with existing administrative evidence.
A Starting Point, Not a Verdict
Decision support works best when uncertainty remains visible
PhillyStat360 is not intended to make a final vacancy determination. Administrative labels reflect past enforcement activity, the current model covers residential properties only, and predictions still require validation through field inspection.
The recommended approach is to use the model alongside the City’s existing indicator—preserving established operational knowledge while surfacing additional properties for review.
This project changed how I think about applied data science. A useful model begins with a carefully designed signal, survives validation that reflects the real environment, and ends in a product that helps someone make a better decision.