SmartCAMA

project overview
SmartCAMA is a data-driven property assessment project focused on improving how Philadelphia property data can be processed, modeled, and reviewed. The project builds an end-to-end infrastructure for collecting public property datasets, preparing them for analysis, generating assessment predictions, and producing visual assets for an assessment review dashboard.
Challenge
Property assessment data is available—but difficult to review at scale.
Philadelphia publishes extensive property, sales and assessment records. However, raw tables alone make it difficult to identify geographic patterns, compare modeled values with official assessments, or understand how an individual property’s value has changed over time.
The project focused on two audiences with different needs:
Tax assessors need a citywide, parcel-level view for locating unusual assessment differences.
Property owners need a simple way to search an address and understand assessment history.
Solution
One data platform, two user experiences.
SmartCAMA combines property records, historical assessments, parcel geometry and machine-learning predictions in a shared cloud data pipeline.
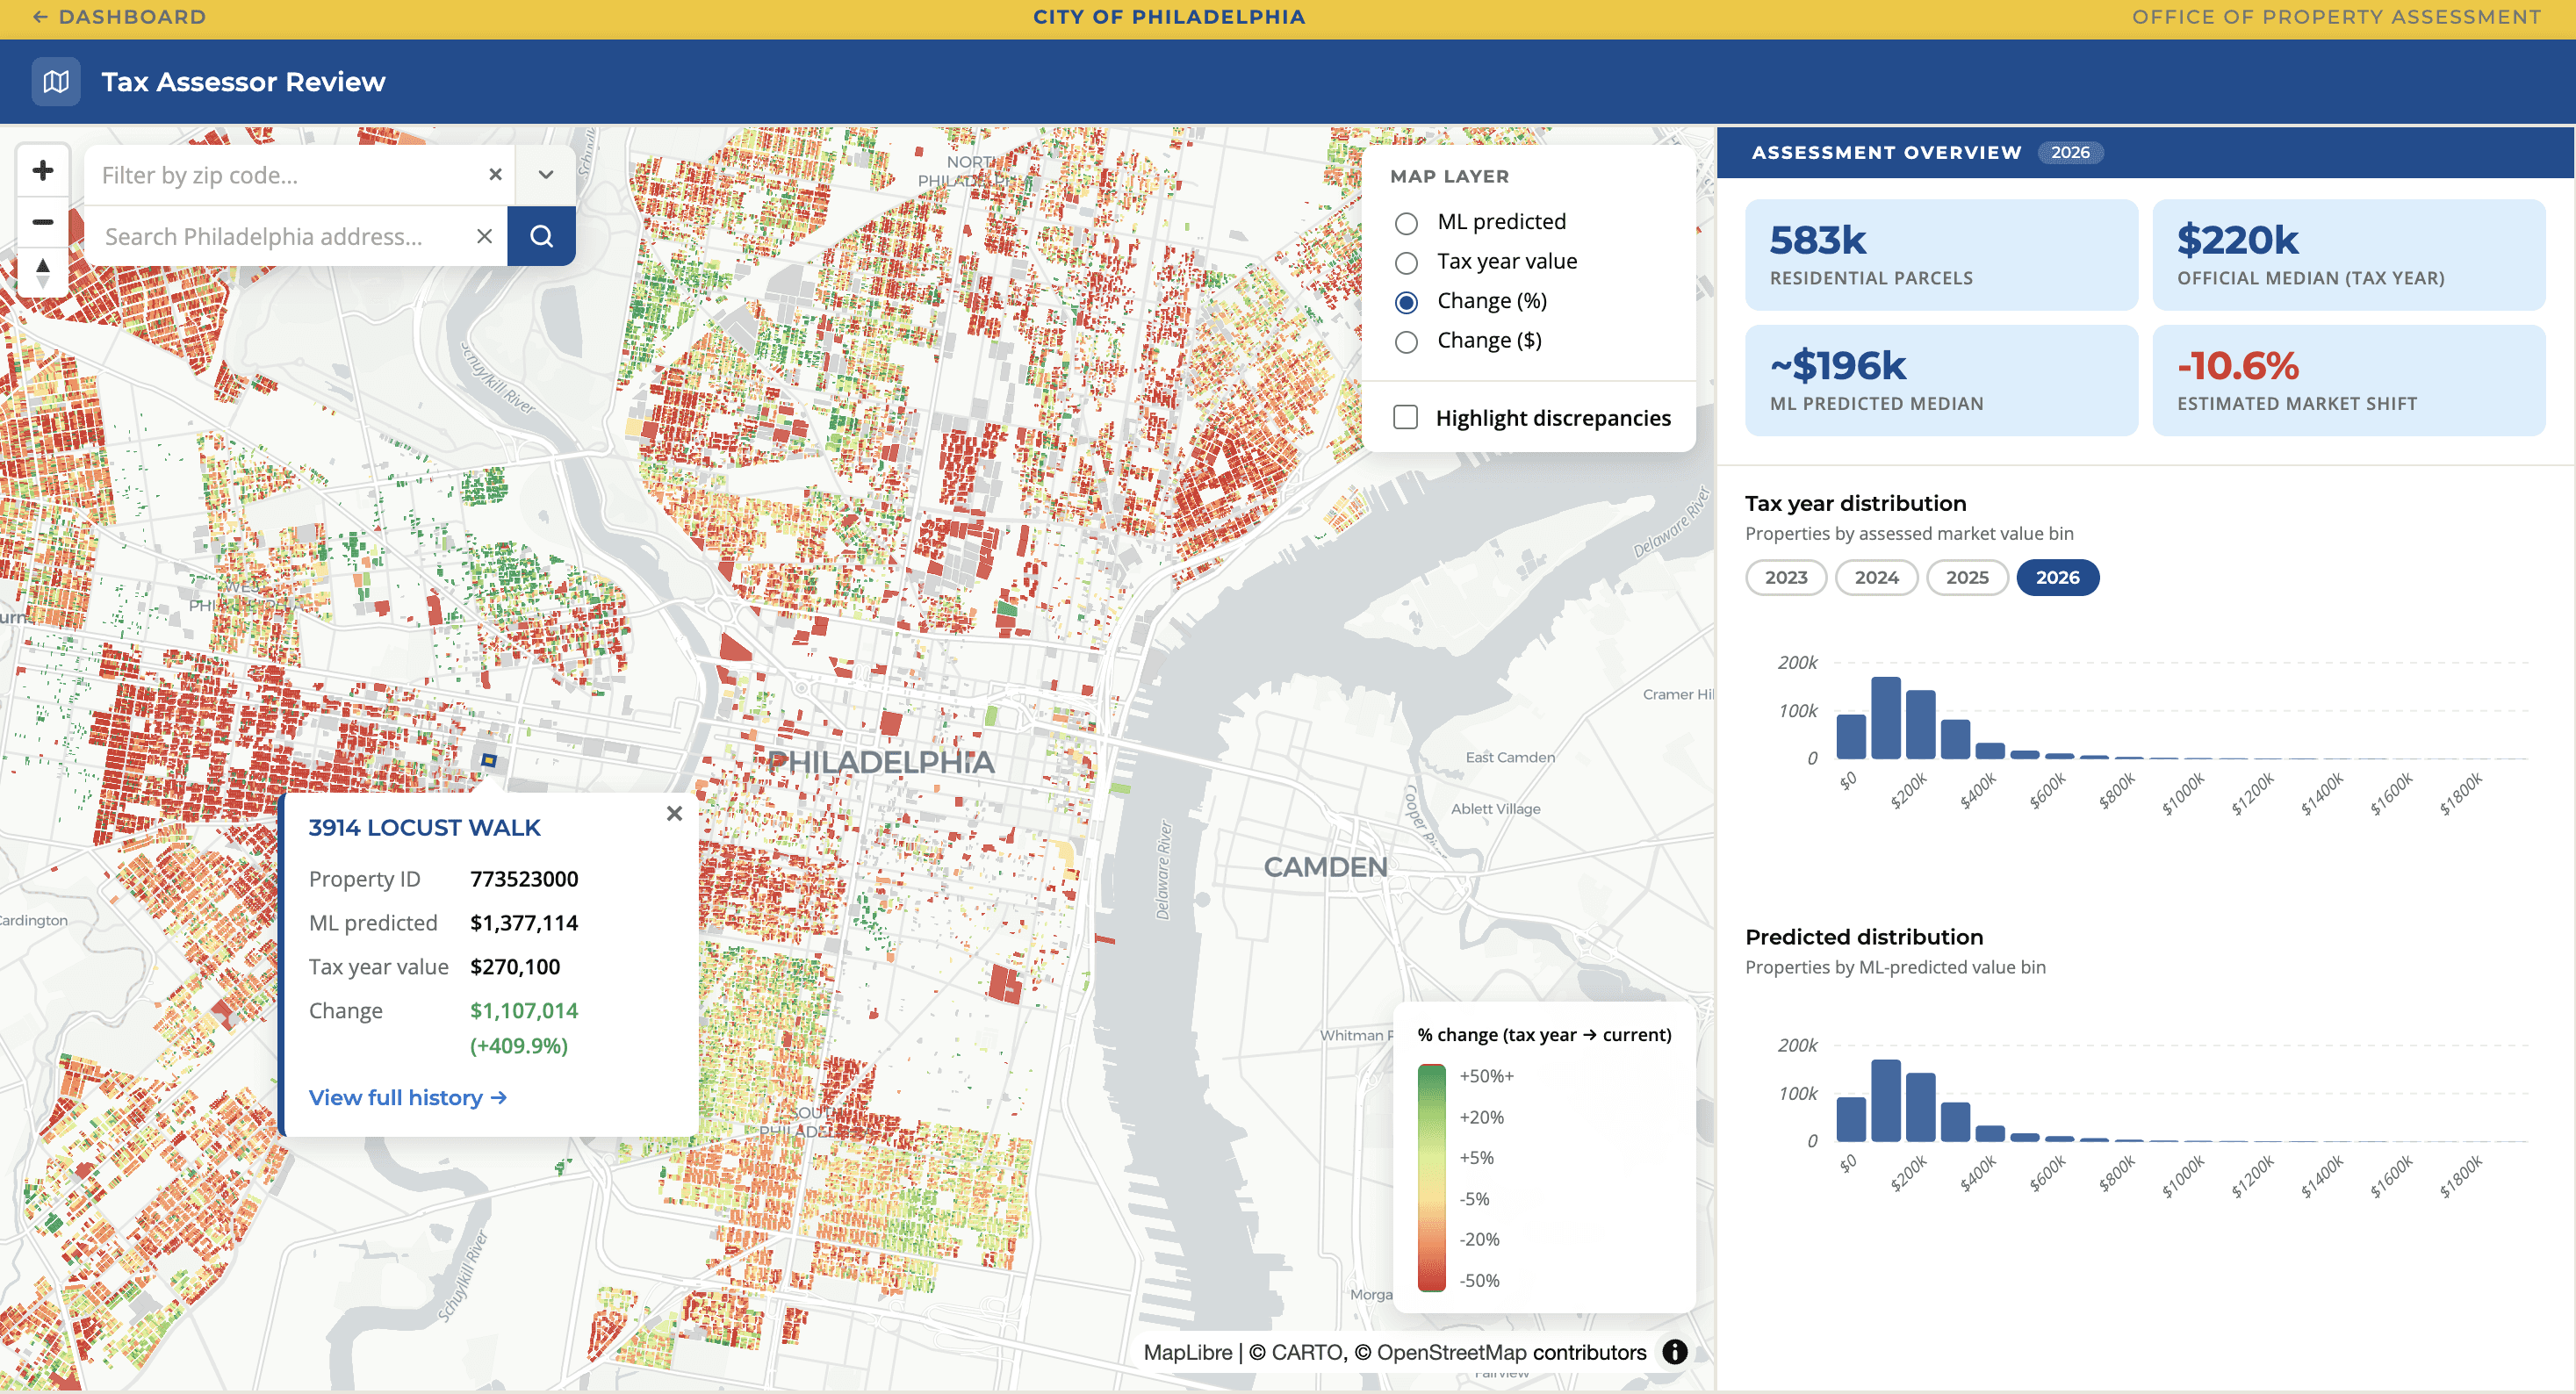
Tax Assessor Review
An interactive parcel map allows assessors to:
Compare ML-predicted and official assessed values
Switch between value and difference layers
Filter properties by ZIP code
Highlight parcels with large discrepancies
Review citywide value distributions
Property Owner Widget
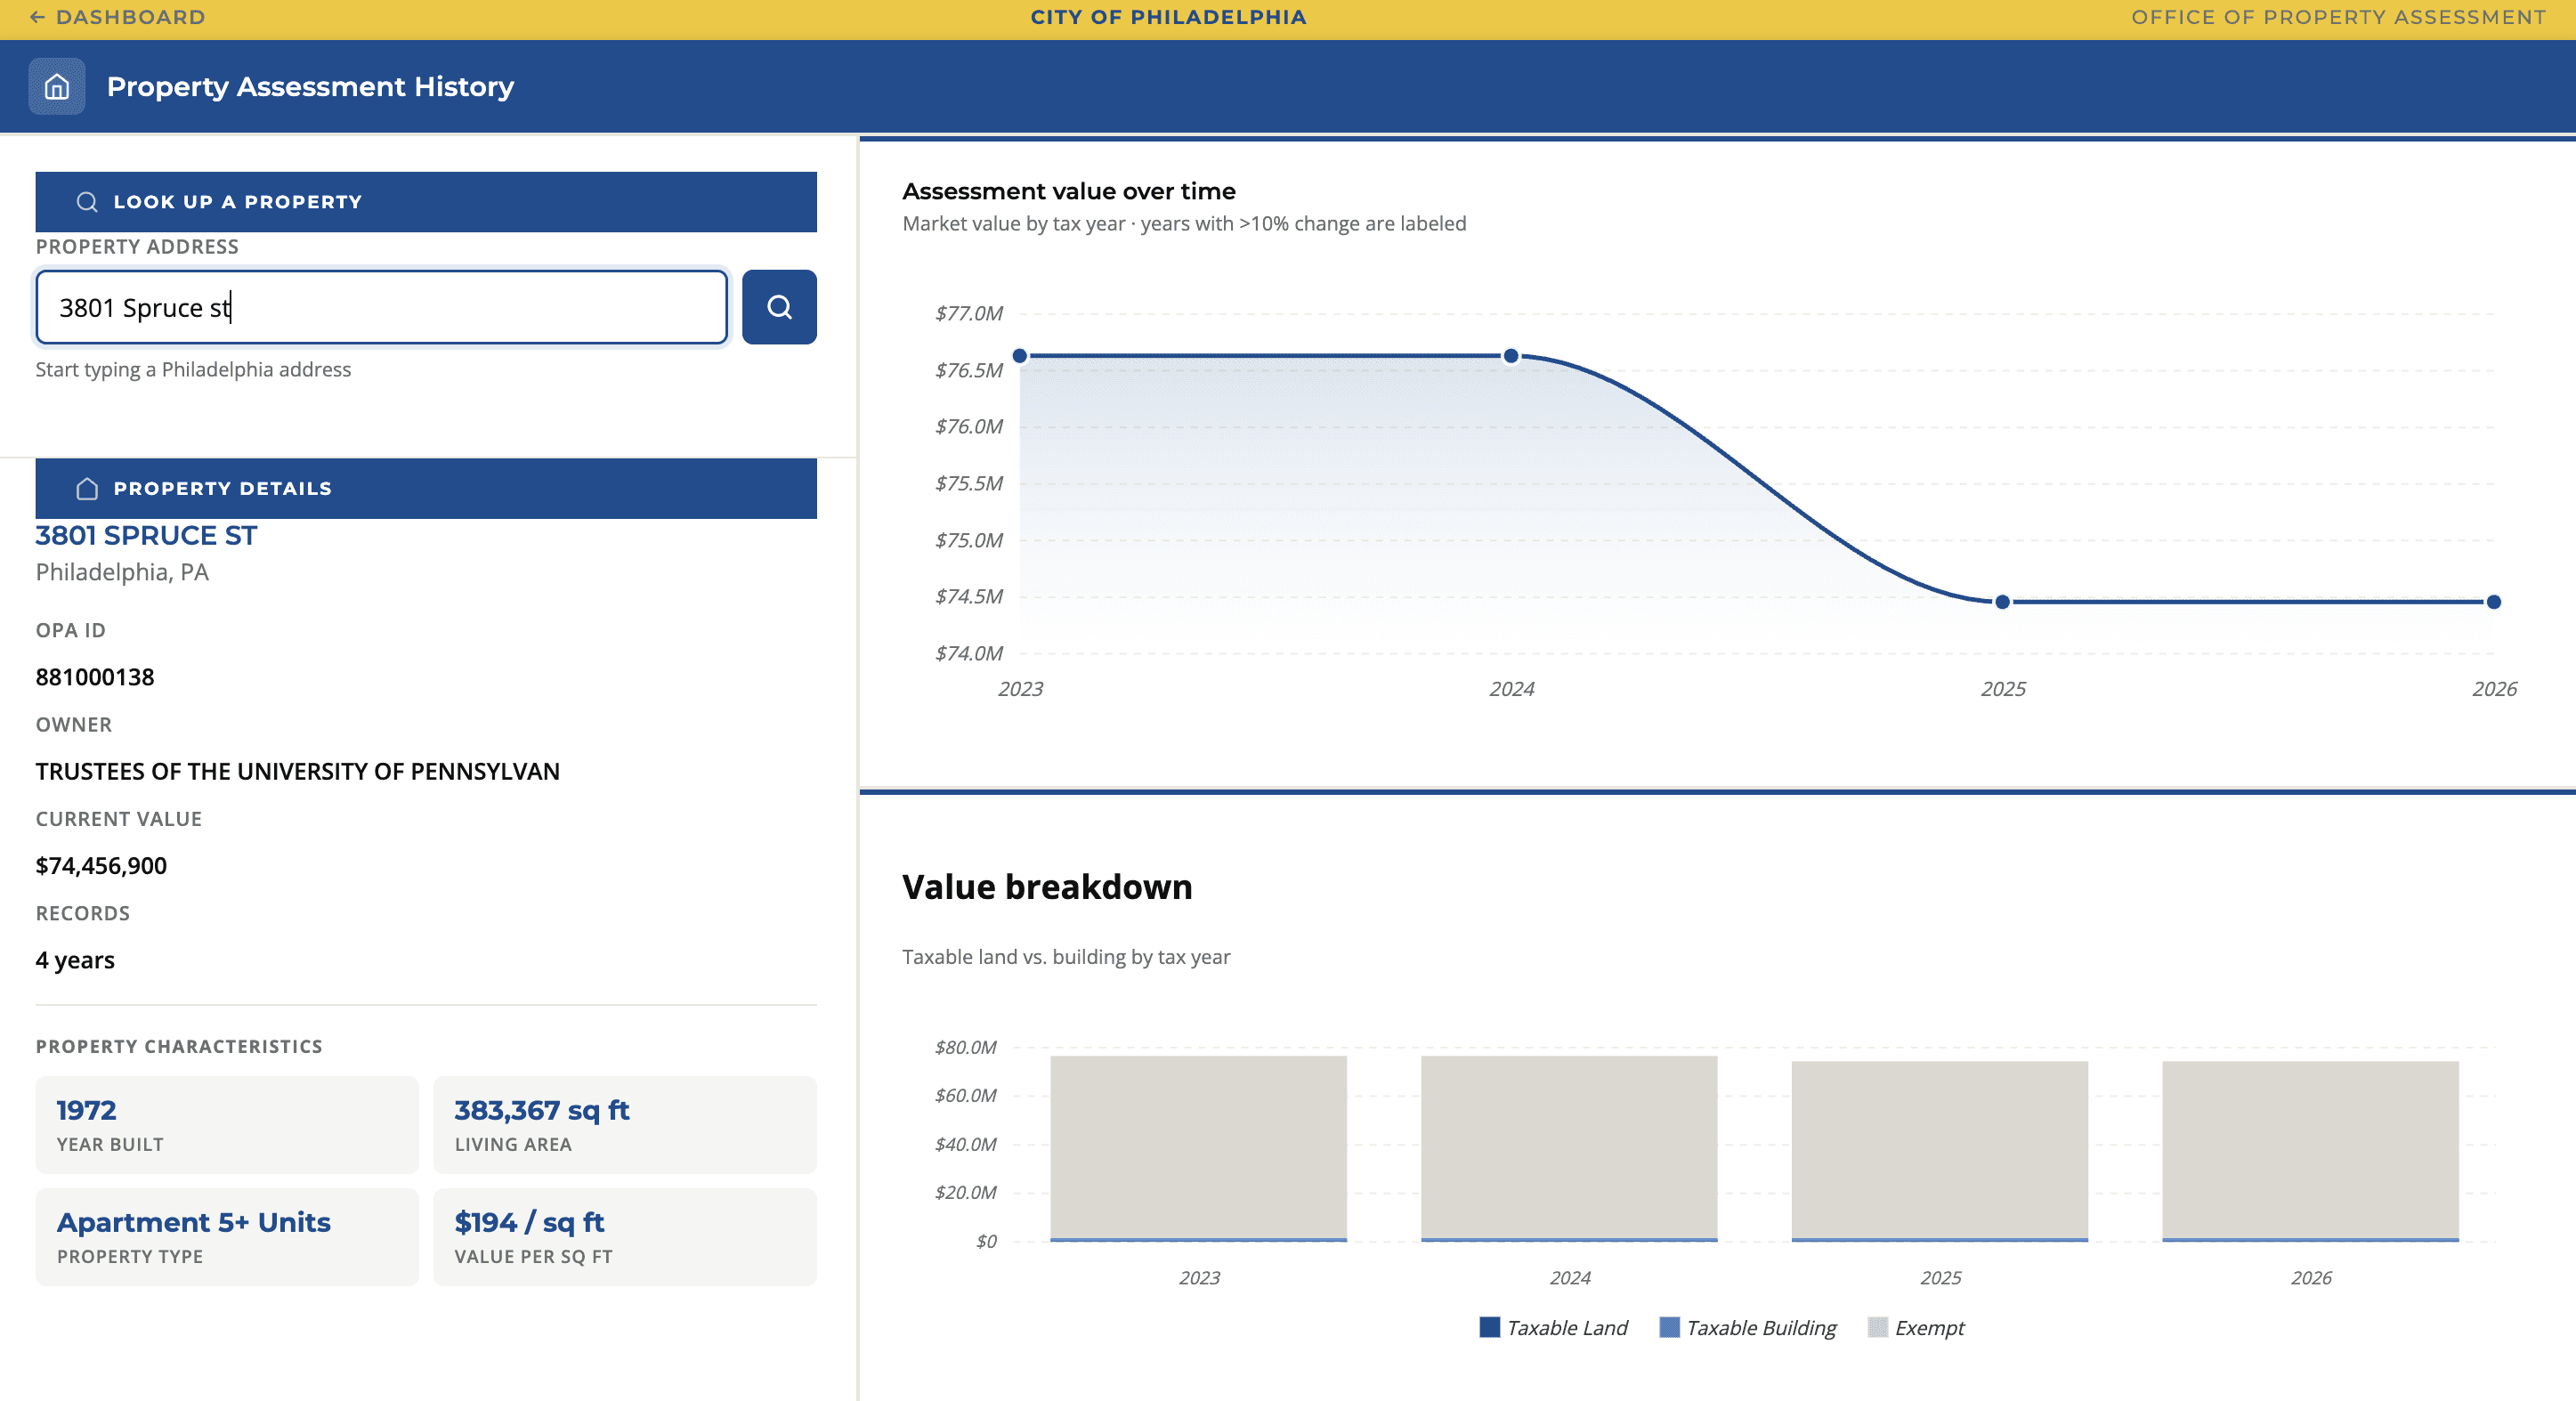
A public-facing lookup experience allows residents to:
Search by address
Review property characteristics
Explore assessment history
Identify significant year-over-year changes
Compare land and building values
From Open Data to an Interactive Map
Building an end-to-end geospatial data pipeline
The system ingests Philadelphia property and parcel datasets, prepares them for analysis, trains a valuation model in BigQuery ML, and publishes the resulting information as lightweight browser-ready assets.
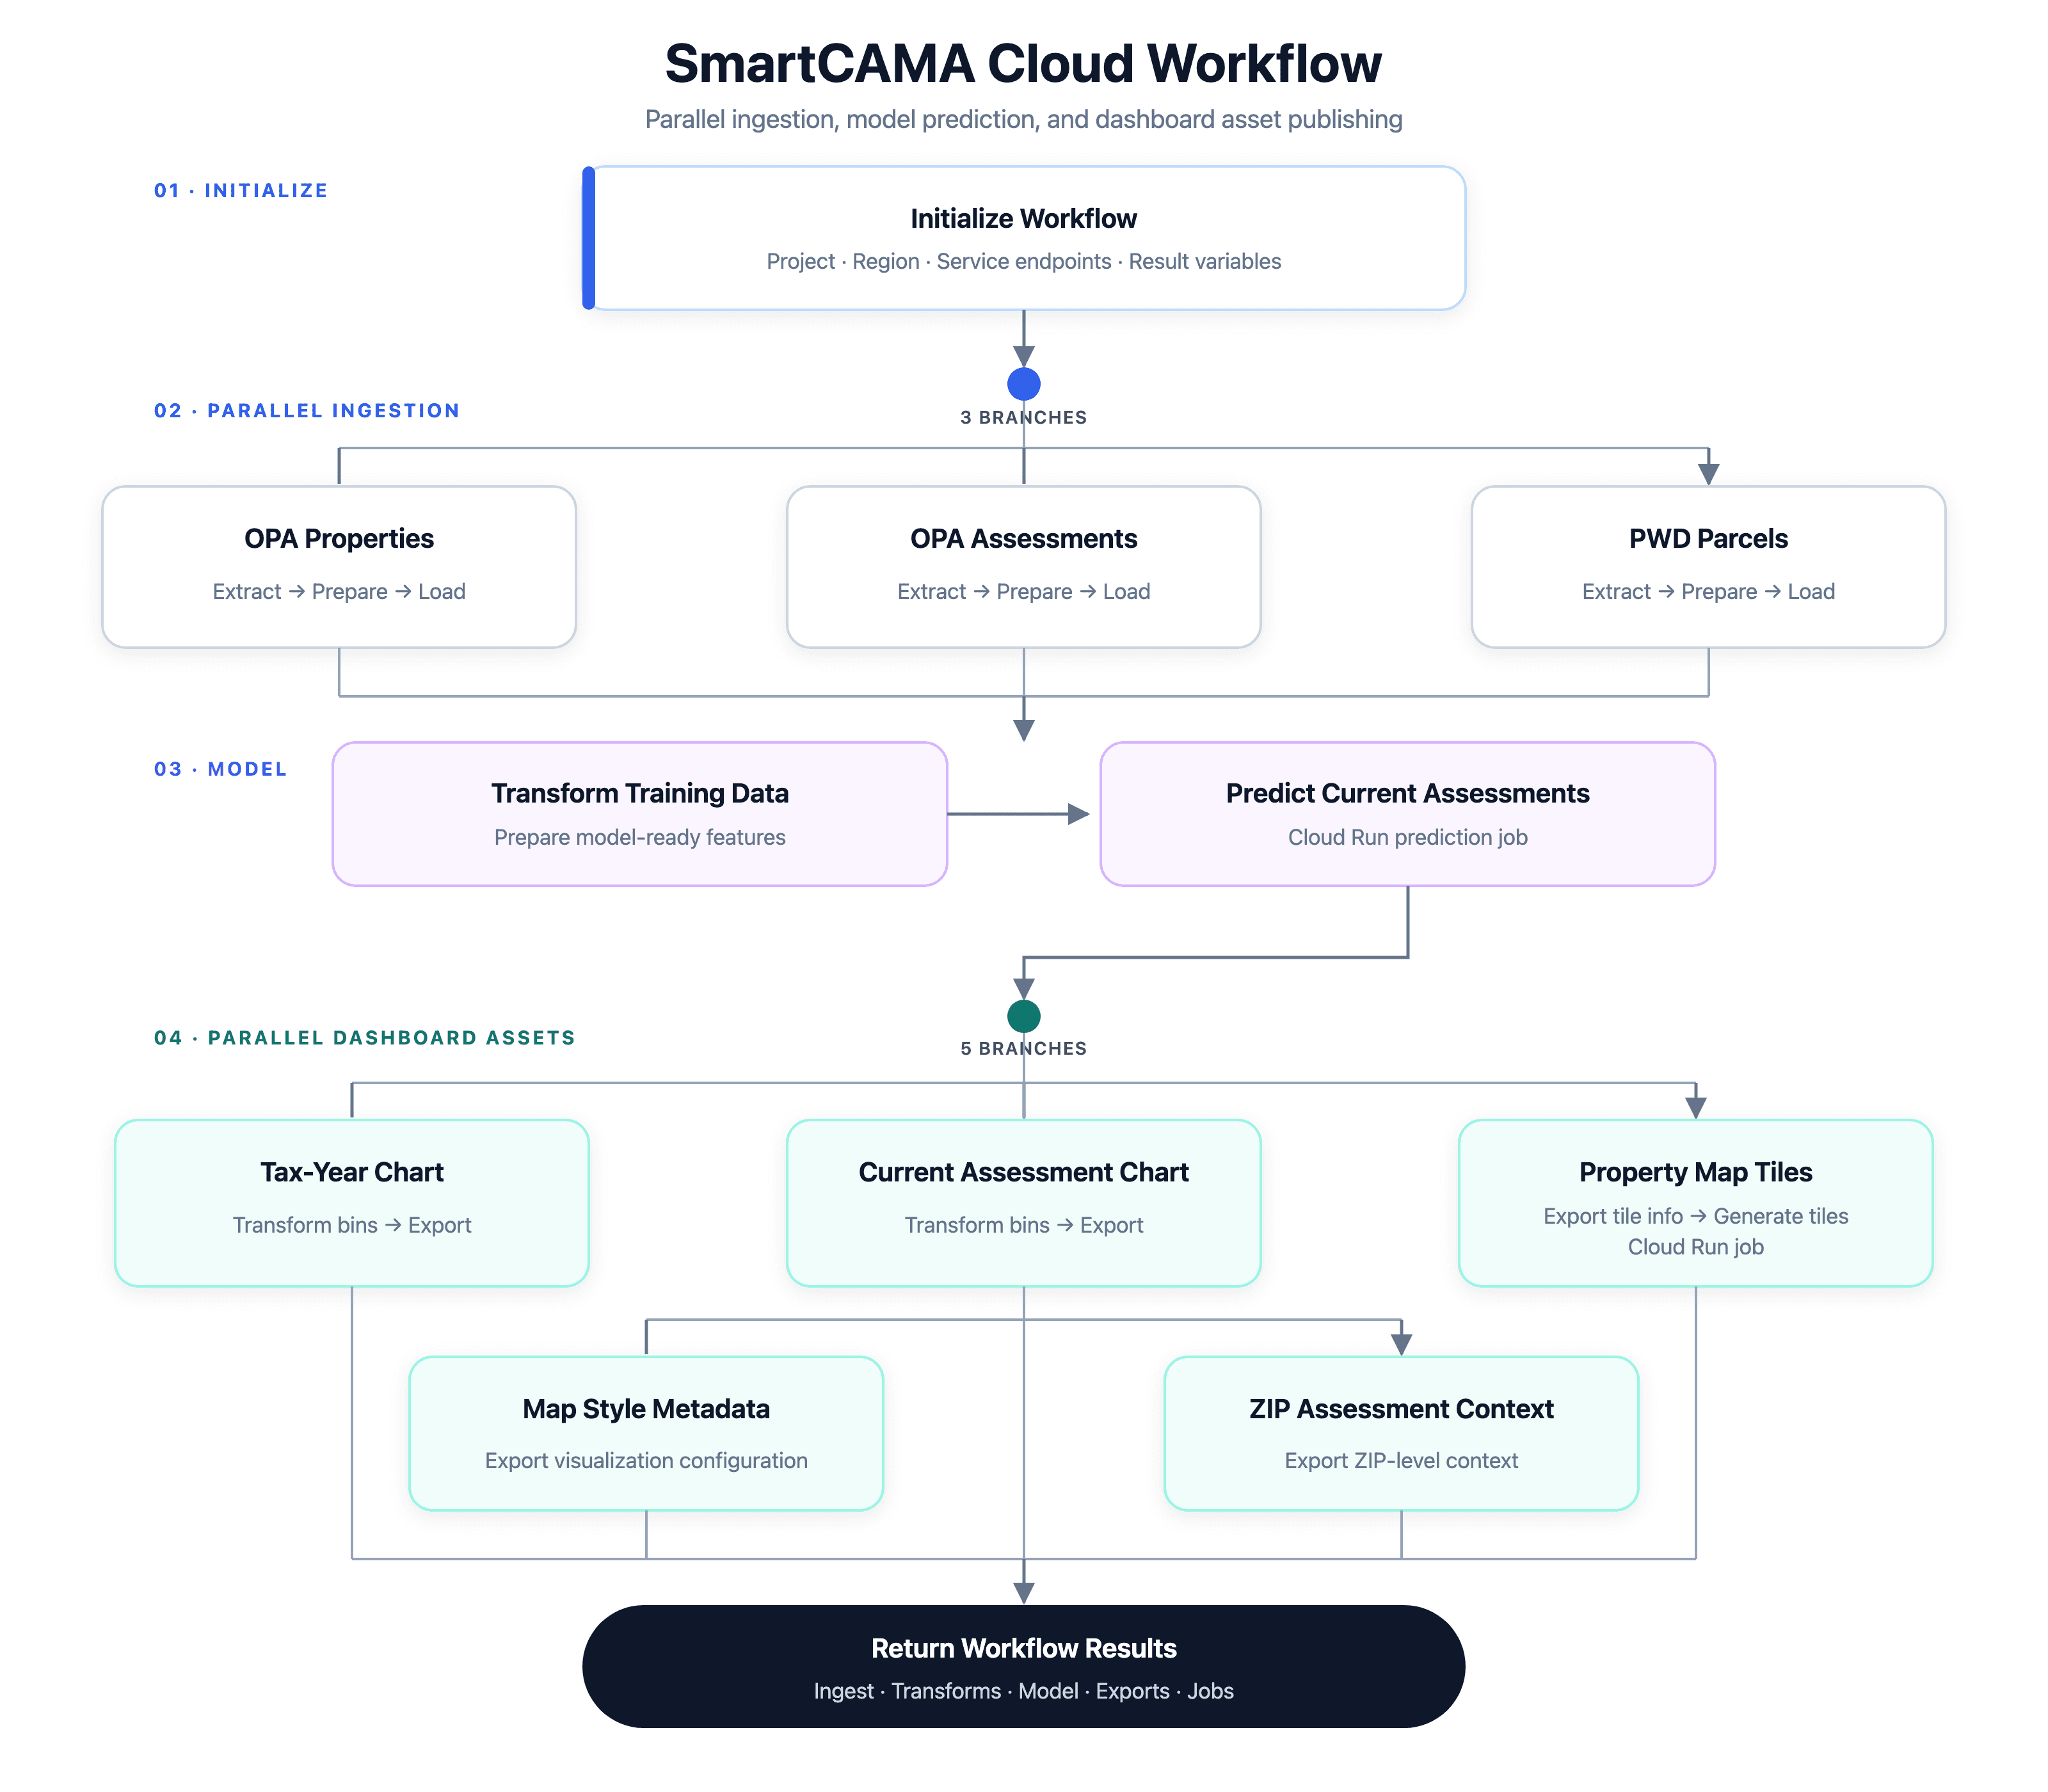
The pipeline separates data into raw, prepared, core and derived layers, making each transformation easier to trace and reproduce. Parcel geometry is stored as geographic data in BigQuery, exported as GeoJSON, and converted into vector tiles with GDAL/OGR for efficient map rendering.
Modeling Property Values
Turning recent residential sales into assessment estimates
A random-forest regression model was trained using recent arm’s-length residential sales. The preparation process excludes bundle transactions, nominal transfers and extreme price outliers that could distort the model.
Features include:
Living and total area
Bedrooms and bathrooms
Building age and condition
Building and property type
ZIP code
Sale recency
The resulting predictions are joined back to parcel geometry and compared with official tax-year assessments.
SmartCAMA is a prototype. Its predictions are intended for exploration and review, not as official property assessments.
Designing for Two Levels of Understanding
Citywide patterns and individual property stories
The assessor interface emphasizes comparison and anomaly detection. Color-coded parcel layers expose geographic patterns, while the discrepancy filter narrows attention to properties that may require further review.
The owner interface reduces the same underlying data into a more understandable narrative: what the property is, how its assessed value has changed, and how land and building values contribute to the total.
Outcome
A reusable prototype for transparent, parcel-scale assessment review
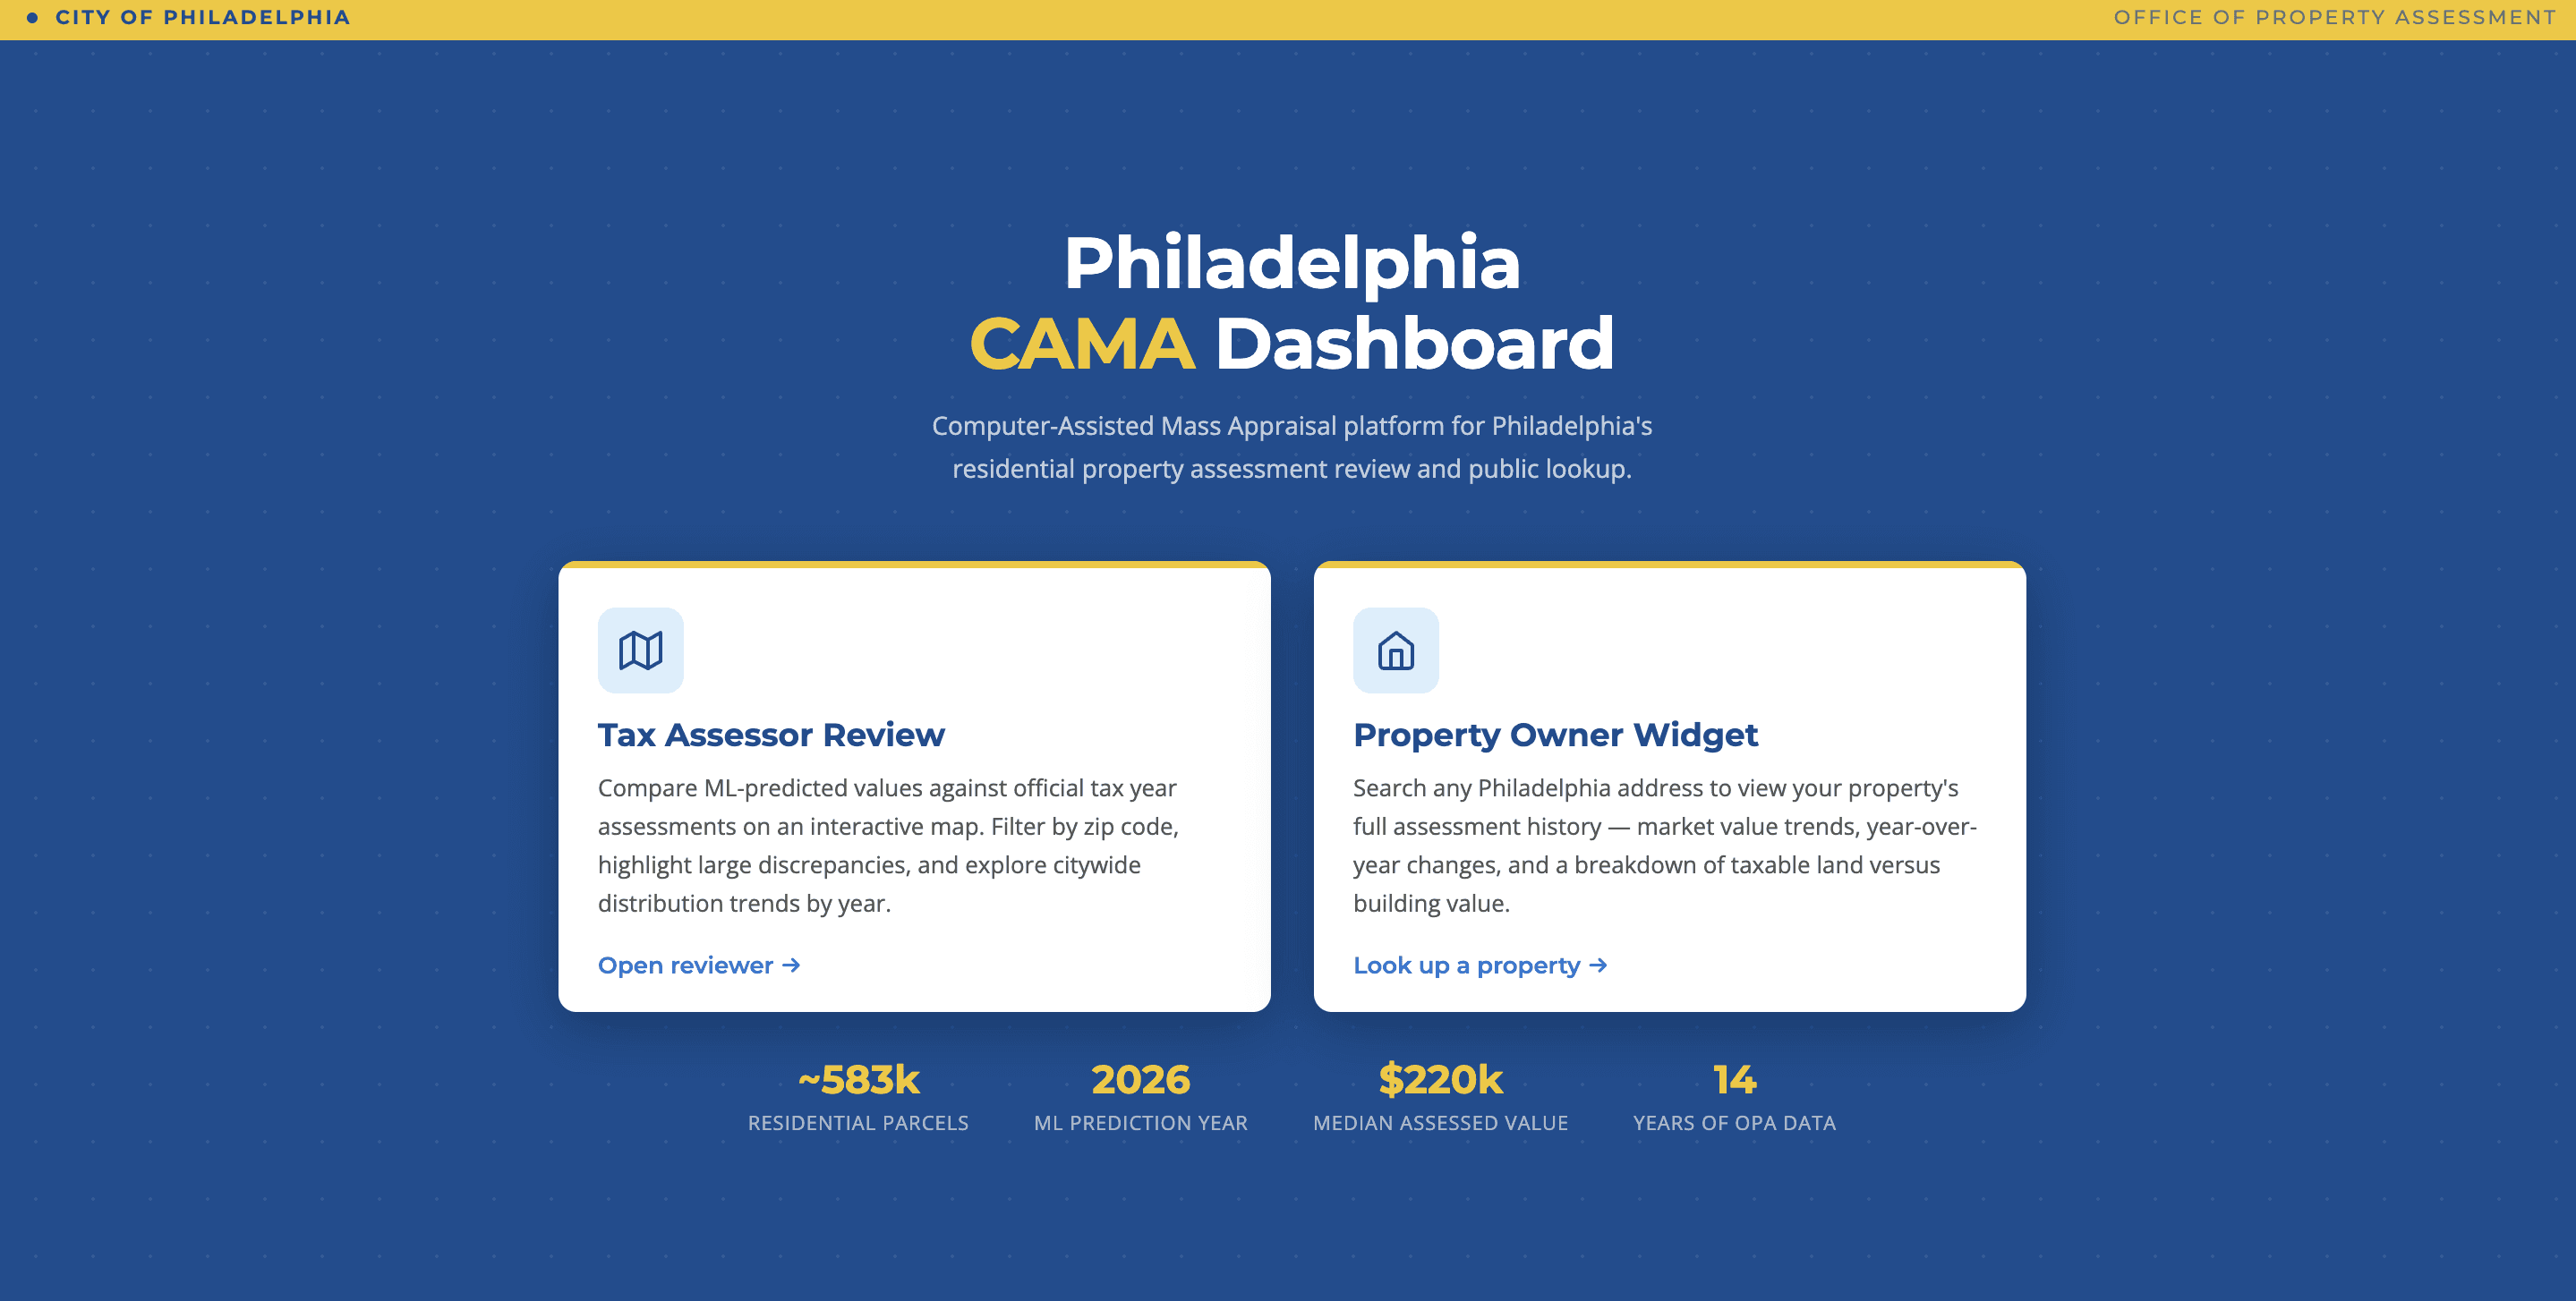
SmartCAMA demonstrates how cloud data engineering, machine learning and Web GIS can work together as a single public-sector data product.
The prototype delivers:
A reproducible cloud-based data workflow
Parcel-scale visualization for approximately 424,000 residential properties
A shared data foundation for professional and public-facing tools
Efficient browser rendering through vector tiles
A more accessible way to explore assessment history
Reflection
What I learned
Reliable data foundations matter more than model complexity
The most difficult part of building SmartCAMA was not training the random-forest model—it was creating a consistent data foundation. Property records, assessment histories, and parcel geometries came from different sources and had to be standardized around a shared property identifier before they could be analyzed together. I learned that even a strong model becomes unreliable when joins, field types, or historical records are inconsistent.
Web-map performance begins in the data pipeline
Rendering hundreds of thousands of parcel polygons directly as GeoJSON would create an unnecessarily heavy browser experience. Converting the map-ready dataset into vector tiles allowed the application to load only the properties needed at each zoom level. This showed me that responsive Web GIS depends as much on data formats and publishing architecture as it does on front-end code.
Predictions need context, not just presentation
A modeled property value can look authoritative when displayed on a polished map. I learned that prototype predictions must be clearly separated from official assessments and accompanied by methodology, limitations, and uncertainty. Future development should include neighborhood-level residual analysis, fairness evaluation, model explanations, and user testing with both assessors and residents.